Homology Modeling (HM) is the most effective method for predicting protein structure from its sequence. This tool uses the structures of homologous proteins, or protein fragments, as an estimate for your protein structure and then models conformational differences that are likely to exist due to sequence divergence.
This tutorial will walk you through how to run HM, beginning with deciding whether HM is an appropriate tool for your sequence.
Please note that all Homology Modeling runs will be charged to your account, including any runs following this tutorial. The results of the HM run from this tutorial are included and can be downloaded for you to view.
IDENTIFYING REGIONS WITH HIGH SEQUENCE IDENTITY
It is important to determining how accurate HM will be for your sequence before you begin a run. As HM is significantly biased by homologous structures, the accuracy of HM results correlate to the sequence identity of available homologs in the PDB.
In general HM is very accurate when the target sequence shares 40% or greater sequence identity to structures in the PDB, and varies in accuracy with sequences between 20-30% sequence identity.
Often times your full sequence will need to be split up into smaller regions that have a high enough sequence identity, with different HM runs for each region.
Throughout this tutorial the full FASTA sequence for the Arabidillo-1 protein(NP_566029.1) will be used. Outlined below are two approaches for identifying regions of your sequence that will have high enough sequence identity
1.) Approach A: Using the BLAST database
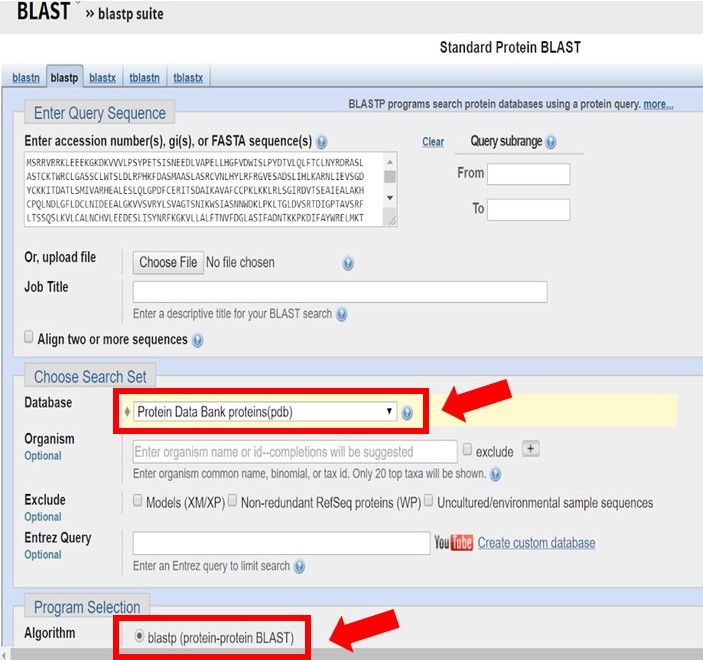
Enter the Arabidillo-1 FASTA sequence into a protein-protein BLAST search, ensuring that the PDB database and blastp have been selected as shown below.
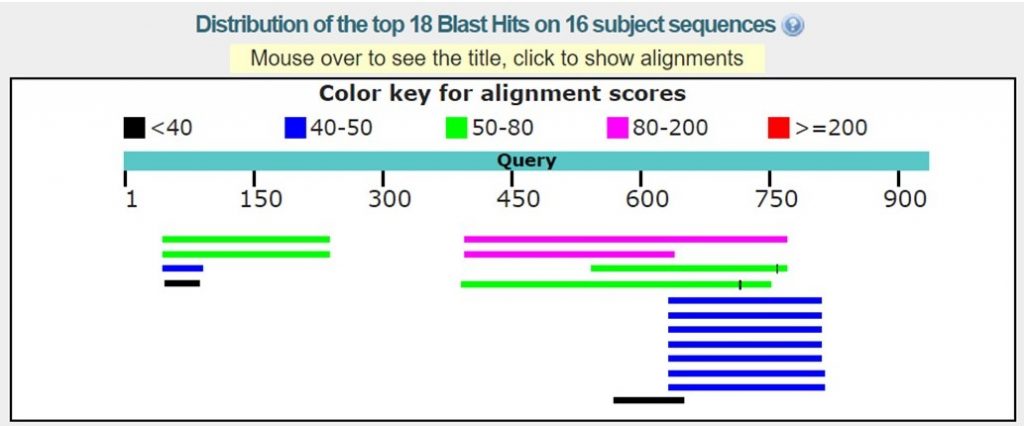
As shown in the image below there may only be homologous proteins or protein fragments in the PDB for certain regions of your sequence.
For this tutorial only regions with 30% sequence identity or greater will be used. As outlined below in red the BLAST results with the appropriate sequence identity have 38% and 40% sequence identity.
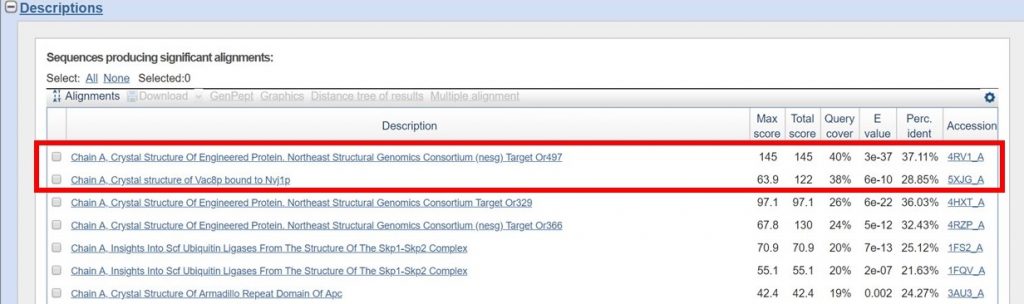
You can view the sequence alignments for each of these results, to determine what region of the sequence had the appropriate sequence identity. As shown below, the region of the sequence that aligned with 40% identity is from residues 394 to 767.
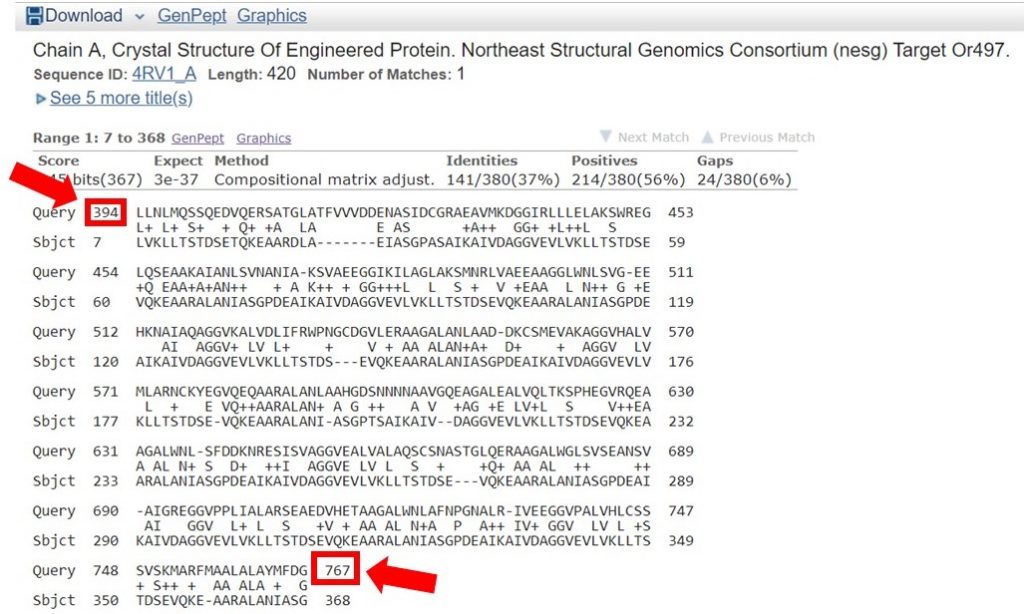
The second sequence that aligned with 38% identity was within this region as well; for this tutorial only the longer region will be used for HM. In general it is safe to include an additional 20 residues on each end of the region that had a high enough sequence identity, to allow for proximal regions that may be interacting.
You have now identified the region of your sequence that HM should be run on.
2.) Approach B: Using the PDB
As shown below, enter the full Arabidillo-1 FASTA sequence into the PDB advanced search making sure that the query type has been selected to Sequence (BLAST/PSI-BLAST), and submit the query.
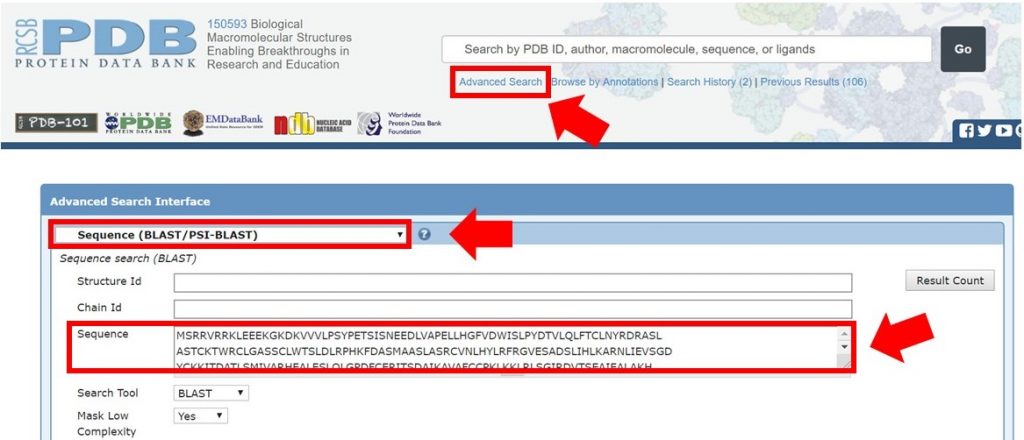
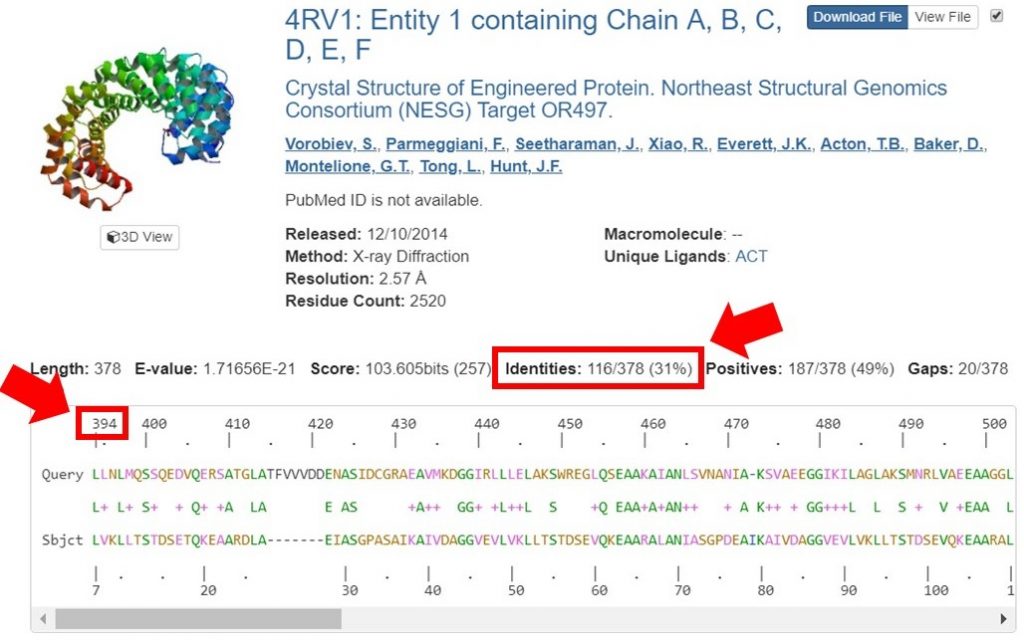
For this tutorial only regions with 30% sequence identity or greater will be used for HM runs. In the search result shown below the sequence identity for the alignment is 31%. The alignment begins at residue 394 of the input sequence and continues to residue 767, which marks the region of sequence that HM should be run on.
RUNNING HOMOLOGY MODELING
Now that you have determined what region of your sequence has an appropriate sequence identity percentage you can run HM specifically for that region.
From either the BLAST or PDB search the region of the Arabidillo-1 example sequence that was identified for HM is:
LLNLMQSSQEDVQERSATGLATFVVVDDENASIDCGRAEAVMKDGGIRLLLELAKSWREGLQSEAAKAIANLSVNANIAKSVAEEGGIKILAGLAKSMNRLVAEEAAGGLWNLSVGEEHKNAIAQAGGVKALVDLIFRWPNGCDGVLERAAGALANLAADDKCSMEVAKAGGVHALVMLARNCKYEGVQEQAARALANLAAHGDSNNNNAAVGQEAGALEALVQLTKSPHEGVRQEAAGALWNLSFDDKNRESISVAGGVEALVALAQSCSNASTGLQERAAGALWGLSVSEANSVAIGREGGVPPLIALARSEAEDVHETAAGALWNLAFNPGNALRIVEEGGVPALVHLCSSSVSKMARFMAALALAYMFDG
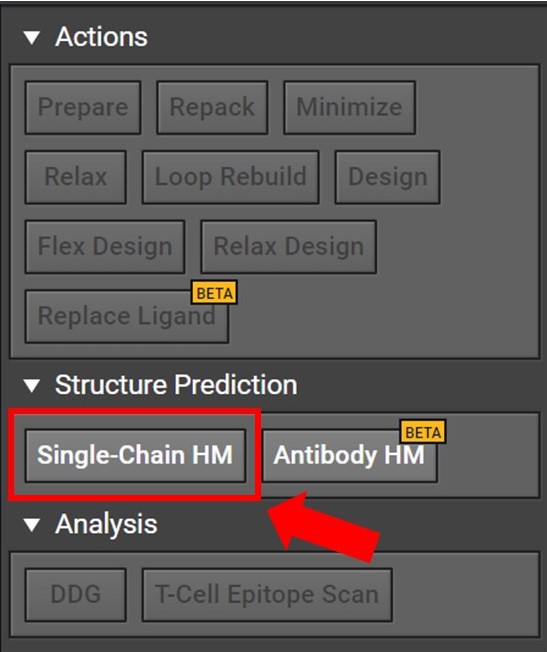
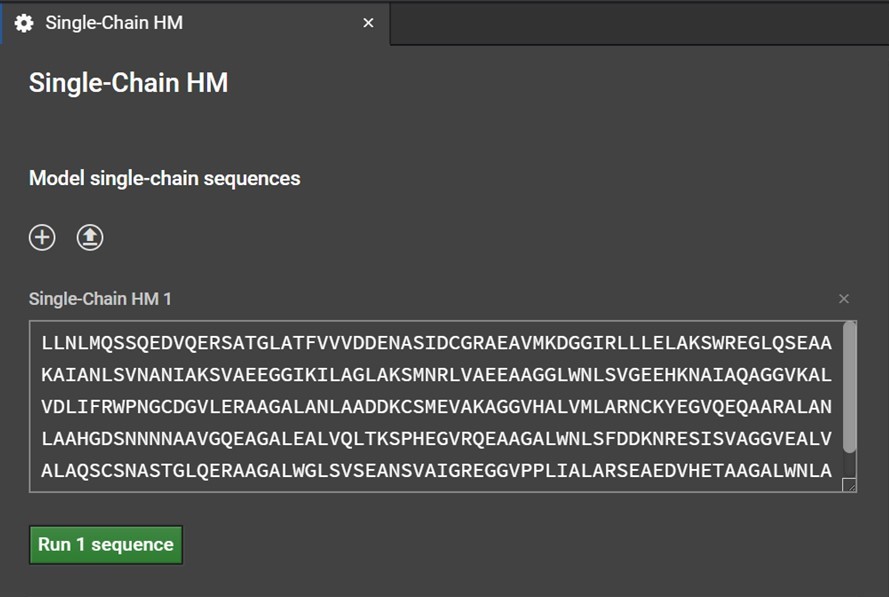
Begin by opening a project in CAD and select the Single-Chain HM button located to the right under Structure Prediction as shown below.
Clicking Single-Chain HM button will open a tab in the center window. Enter your sequence into the box as shown below. Please note, currently HM can only model the canonical 20 amino acids: do not enter non-canonical letters or symbols including spaces or else an error warning will be issued.
You can also click ![]() in order to upload a file containing FASTA format sequences of one or more runs. Clicking
in order to upload a file containing FASTA format sequences of one or more runs. Clicking ![]() will bring up another box if you would like to paste another sequence.Once you have entered or uploaded your sequences, click
will bring up another box if you would like to paste another sequence.Once you have entered or uploaded your sequences, click ![]() and your job will begin processing.
and your job will begin processing.
Please note: again you may choose not to run this tutorial example because all HM runs will be charged to your account. If you would like to view the alignment files from this tutorial example please see the links below.
HM is the most time-consuming process that can be run; the length of the run time is dependant on the length of your sequence. If you have a 1,000 residue structure, it could take well over 24 hours to process. A 25 residue structure could be done in under an hour.
RENAMING A HOMOLOGY MODELING RUN
You can rename the HM run at any time after you have clicked Run. There are two ways to access the HM submission name as outlined below:
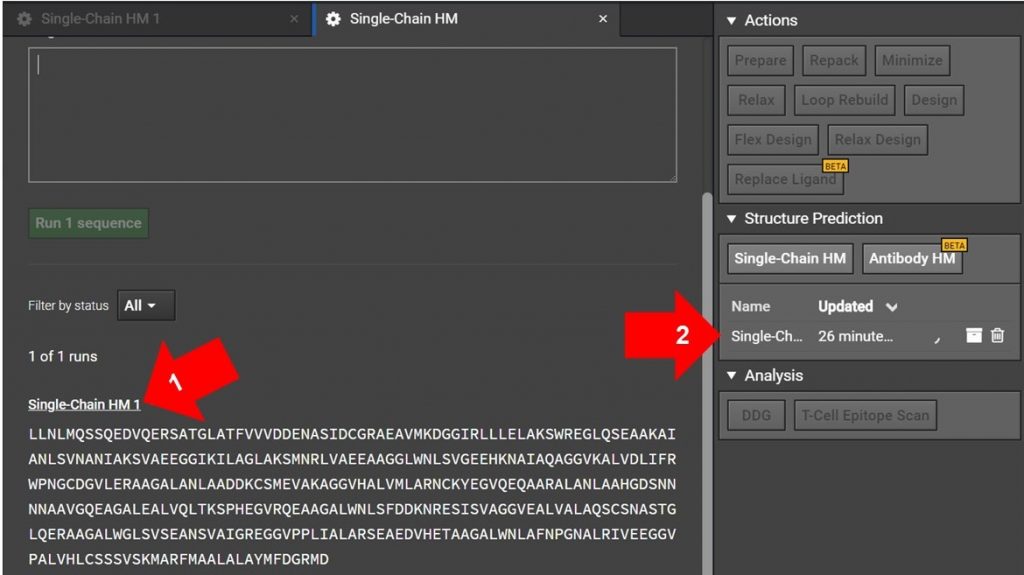
Arrow 1: If you have just submitted the HM run and the Single-Chain HM tab is still open as shown above, click on Sing-Chain HM 1 as indicated with arrow 1. This will open another tab for the run.
Arrow 2: If the original HM run tab is not still open, click on the Single-Chain HM #1 on the job list in the right window as shown with arrow 2 above. This will open the HM run in a new tab.
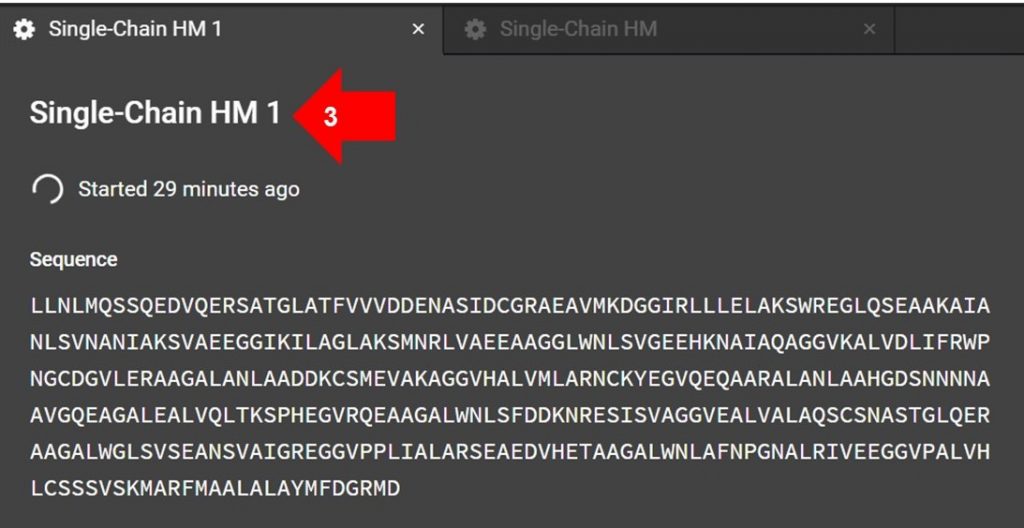
Once the HM submission tab is open, click the name indicated by arrow 3 in the image above to edit the submission name.
If the job has finished running, you can click on the pencil icon to the right of the file name ![]() that can be found in the left window. This will allow you to change the name.
that can be found in the left window. This will allow you to change the name.
HOMOLOGY MODELING RESULTS
The HM structures, sequences, and alignments for this tutorial are available for download below:
To open your HM results in CAD click on the ![]() results folder for your finished run, located in the left window. This will open a new tab as shown below.
results folder for your finished run, located in the left window. This will open a new tab as shown below.
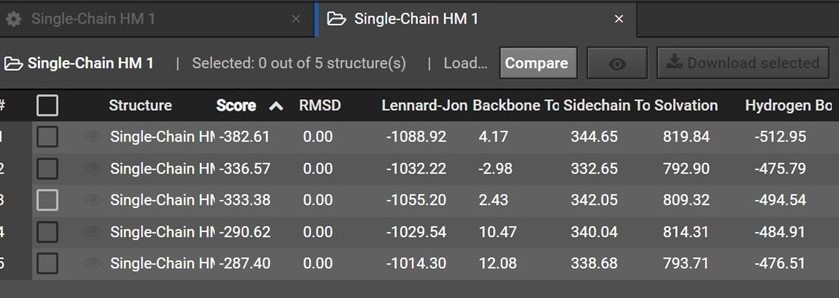
During HM 200 structures are predicted and are then grouped by shape into five clusters. Each of the five structures in your HM result is a representative structure from one of these clusters. The clusters and representative structures are ordered in your results by score.
Please note however that the second structure is not the second best structure, instead this structure should be used as an indication of how similar the first and second clusters are.
Assessing the Structure Prediction Results
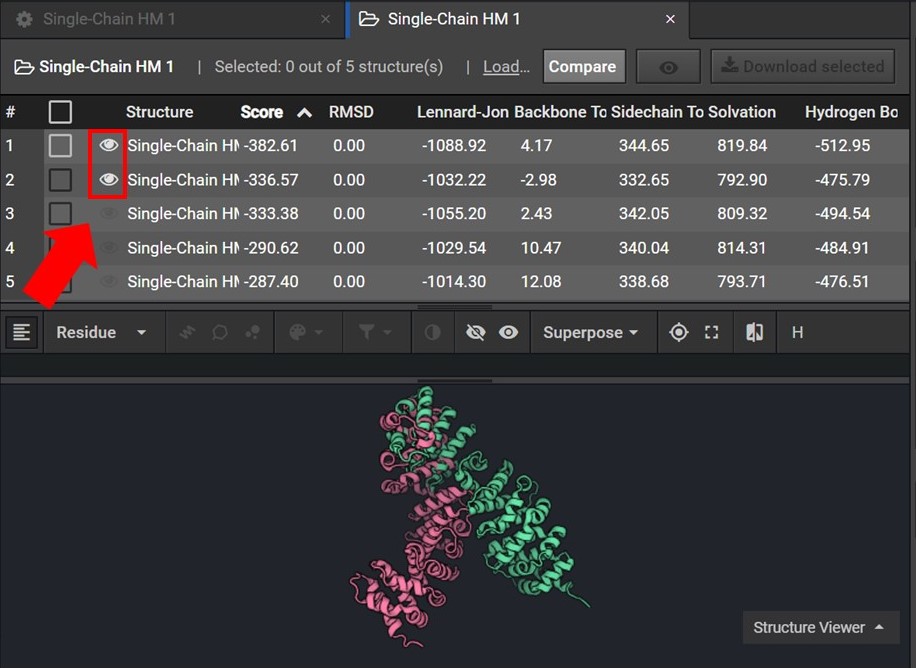
To assess the accuracy of your results first sort your results by Score and then view the two lowest score structures in the Structure Viewer by selecting ![]() next to each structure name as shown below.
next to each structure name as shown below.
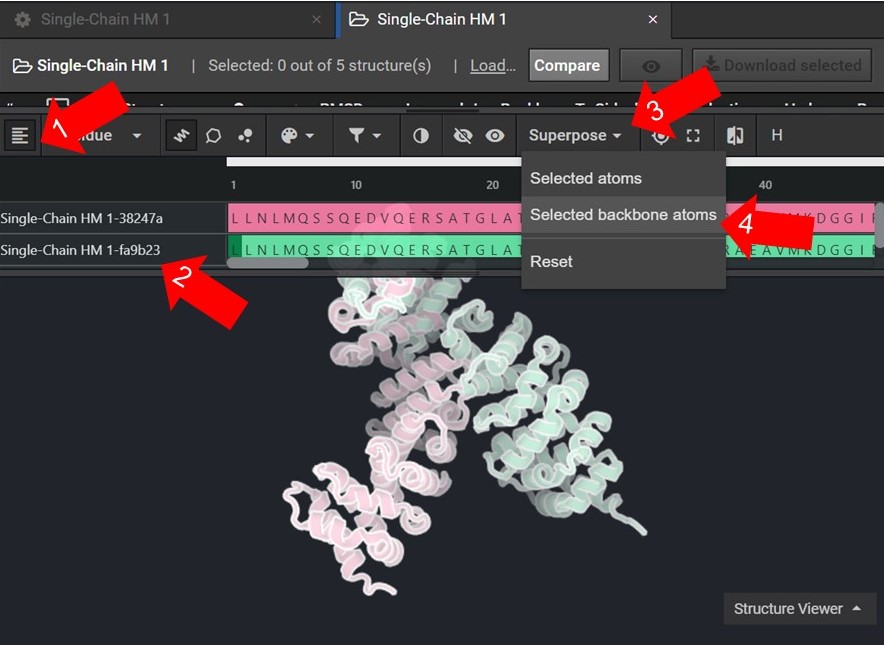
As shown below click ![]() to view the structures’ sequences (Arrow 1) and highlight both sequences by click on each sequences’ name(Arrow 2). Then use the superpose tool (Arrow 3) to align the two structures by backbone atoms (Arrow 4). For a more in-depth tutorial on these CAD features please visit Tutorial 1 and Tutorial 2.
to view the structures’ sequences (Arrow 1) and highlight both sequences by click on each sequences’ name(Arrow 2). Then use the superpose tool (Arrow 3) to align the two structures by backbone atoms (Arrow 4). For a more in-depth tutorial on these CAD features please visit Tutorial 1 and Tutorial 2.
If the two structures do not seem to converge after they have been superposed then your HM run may not have reached the energetically minimum structure. To improve the accuracy of your results select the two lowest energy structures from your HM run as input for 20 rounds of Relax. Then input the lowest energy structure from the Relax runs into another HM run.
Using and Accessing the Alignment File
With your HM structure predictions your results include additional information in an alignment file about which known structures were aligned with your sequence. You may find this information helpful when evaluating what regions of your predicted structure are most accurate, as well as illustrating where gaps were in the alignment.
Each alignment between a template structure and your sequence has a corresponding weight indicating the confidence in the alignment. The best alignment receives a weight of 0.6 and the weights decrease from there. The higher the weight of an alignment, the less the predicted structures will be allowed to deviate from the template during the modeling process.
As shown below the alignment file can be accessed from the HM run tab. If you have closed this tab please see the section above, “Renaming a Homology Modeling Run”, for directions on how to reopen the HM run tab.
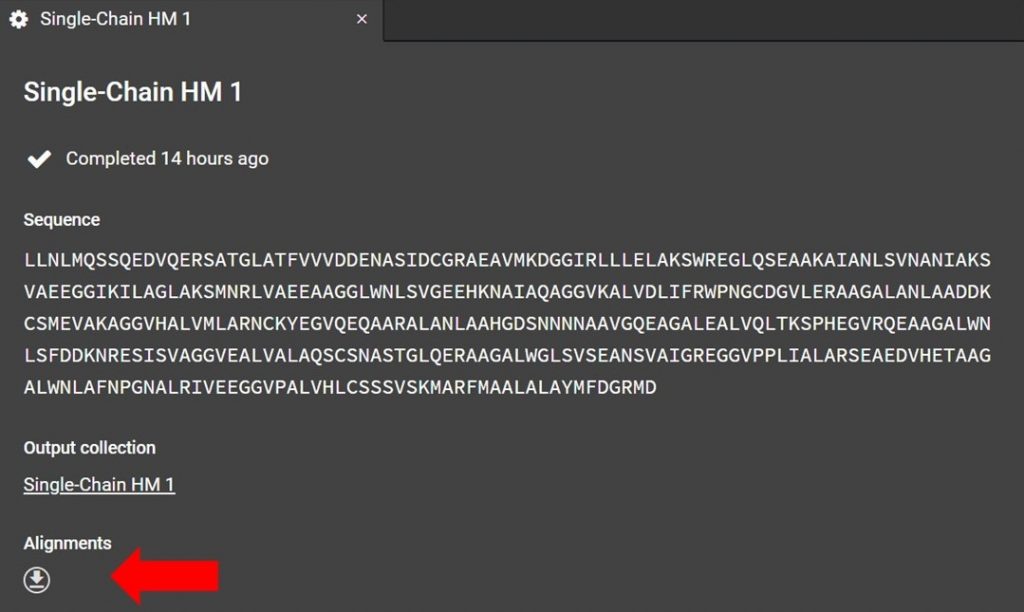
Click as indicated above to download the alignment file. To read the alignment file open it with any text editor that supports monospaced font, for example Atom.
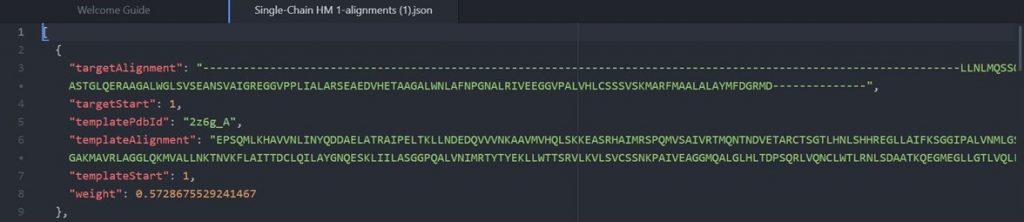
As shown above the alignment file will display the original target input sequence with each template sequence.
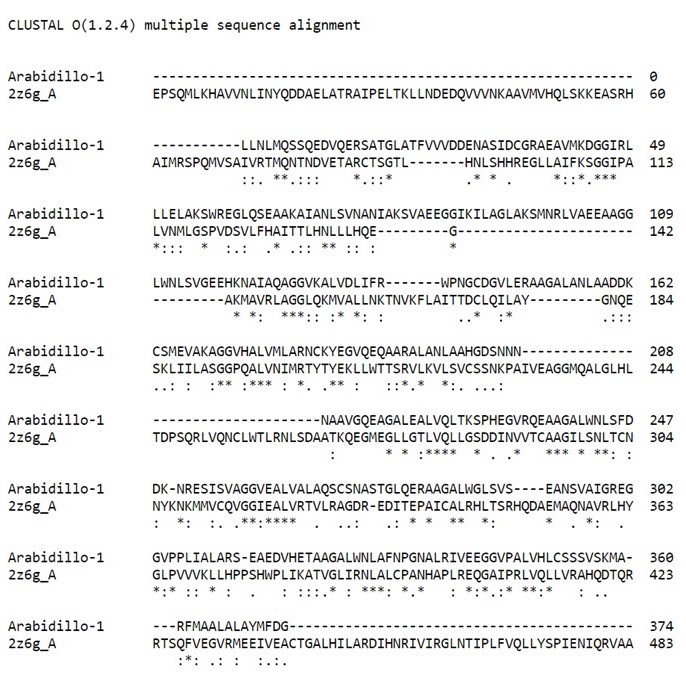
Each alignment can also be better visualized by entering the target and template sequences into Clustal Omega Multiple Sequence Alignment as shown below.