How to analyze output structure quality from HM
DETERMINING CONVERGENCE
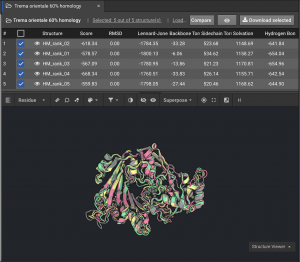
1.) How close are the top models to one another? If the top models are tightly converged (especially in the helices and sheets), that is a good indication of a high quality model. The five models below are well converged.
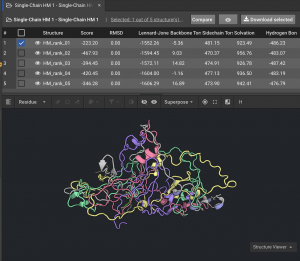
2.) If models are not tightly converged, (like the 59336 example below) we want to understand the basis for that variation:
a.) Are these models reflecting the variation in structure among the known homologous structures?
b.) Do the homologous structures have very low sequence identity to the target sequence?
c.) Are these models highly varied because there are large portions of structure not well-represented in any homologs?
Below is an example of models that are not tightly converged.
CHECKING CONVERGENCE CONFIDENCE
1.) Download the alignment json file by clicking on “Download alignments”. Look through the entire alignment file to identify two or three templates with the highest-weight structures. Please note that currently, the templates in the file are not fully sorted by weight. (Reference to how weights are calculated can be found here.)
a.) For example, if there are templates with weights of 0.5, 0.4, 0.3, 0.2 and 0.15, focus on the structures with weights 0.5 and 0.4.
2.) Load the chosen templates from the PDB (PDB codes for each template are in the alignment file), in a structure viewer and superimpose them. You should see right away if the templates overlap each other well, or if there are regions of poor overlap. For example well-defined subdomains may have different convergence with subdomain one highly converged and subdomain two poorly converged).
3.) As a quick metric of homolog quality, look at the the superimposition of the top two weighted predicted structures from the HM results. If these are closer than 5 Angstroms RMSD to each other, then the quality of homologs is high. If these are further apart than 5 Angstroms RMSD, then there is only moderate homology. If the top two structures do not even have the same overall topology when superimposed, then this is a very difficult modeling situation that may require more than the automated HM pipeline.
SUBREGION CONVERGENCE
To paraphrase Tolstoy’s Anna Karenina principle, all good homology modeling outputs are alike (well converged), all difficult homology modeling outputs are difficult in their own way. Let’s go through some possibilities here:
1.) Rigid Body Subregions: In this scenario, models are tightly converged in one subregion of the protein but not another. The two are related by rigid body movements of region two to region one. In this case, it’s likely that the protein actually has structural domains, and the models are very good within each domain, but the sub-domains are oriented differently in different models.
a.) Say region 2 is residue 150-200
b.) Try superimposing the models just at those positions.
c.) If the models are now very similar in region 2, then, voila, these models are good.
Now look at the top homologs (step 5 above) and the papers where these were published to discover if there are certain conditions — such as ligand binding — that favor one rigid body region 1 / region 2 orientation over another. For example, it may be that your template population has a mixture of “closed” and “open” states, based on the presence of a bound ligand. If you want a ligand bound model, choose the HM output models most similar to those homologs, or select templates accordingly once this capability is made available in Cyrus.
2.) Non-Rigid-Body subregions. Same as (1), but here it is not as simple as rigid body movements between domains. If you see variation in subregions of the models, examine the top homologs and their biochemical condition. Again, you may discover certain conditions such as ligand binding that favor certain backbone configurations, and then you will want to choose the HM output models most similar to those most biochemically relevant homologs.
3.) Homolog structural variants (e.g. ligand bound). Top homologs are very different as described in step (6) above. Here there is a bit of a judgement call. If you can glean information from the publications for these homologs you may find a reason to favor one homolog over another (e.g. ligand bound) which can help you to choose a model.
4.) Homolog alignment variants (e.g. active site). Alternatively, if looking at the homologs and their publications is not particularly revealing, you want to look at alignments. In particular, if you have a specific region of interest (e.g. an active site) you may want to a) identify the homologs with good alignment to that region and then b) Pick the output models most similar to those homologs at (a) based on overall or local structure superimposition.
5.) Regions with no alignment to Homologs. Same as (1) and (2) but when you look through the homologs you are not able to find any alignments for the region with variation. For example, region 81 to 105 in your protein sequence does not align to any homologs and that region has lots of variation in your models.
a.) In order to identify this you have to place the alignments for each of the structures next to each other in a monotype font (like courier) in a simple text editor (not Word), just by copy/paste. Then you can visually see regions lacking any alignment.
b.) These regions were modeled by Rosetta using ab initio fragments.
c.) If this region is mostly helical, you have the highest confidence in models: this is the “best case” ab initio situation.
d.) If the region is mixed alpha/beta or beta you have lower confidence.
e.) If the region is all loop without regular secondary structure you have the lowest confidence, these regions are only trustworthy if there is some model convergence.